What drones and satellites really reveal about your culture
Technical Recommendation for July
A section of the plot is starting to show less vigor. The crop is developing unevenly, and the question arises: could it be a nutritional deficiency?
Nowadays, through drones and satellites, It is possible to detect these differences long before they are visible to the naked eye. However, there is a common misconception: vegetation indices do not directly identify nutritional deficiencies.
What they show is something different, and often more useful. They reveal areas of the plot where the crop is responding in a distinct way and that deserve closer observation.
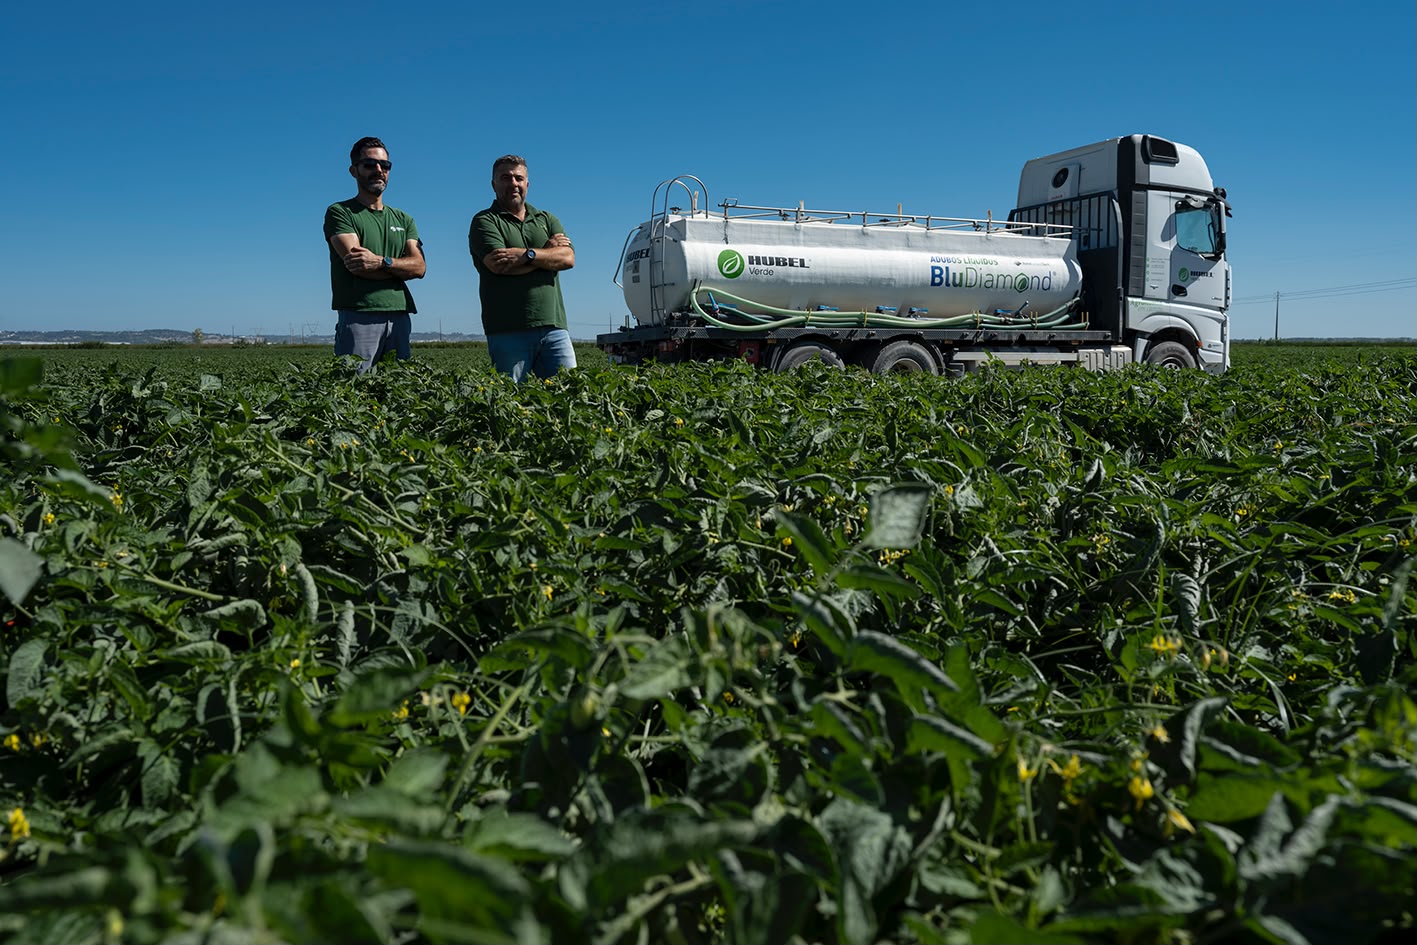
Gonçalo Neves, Drone Manager at Hubel Verde explains how vegetation indices can support the early detection of problems in crops, what their limitations are, and why they still require field validation.
Want to know how we can monitor your farm?
Our technical team is ready to help you improve crop performance with tailored agronomic support.
The map shows where to look; the field explains why.
Vegetation indices play an increasingly important role in supporting agricultural decision-making. They allow for the detection of variations within the same plot, often before visible symptoms appear.
But it is important to understand what these indices really show us.
“Maps allow for the quick identification of areas in the plot that deserve attention. But they do not explain, by themselves, the cause of the problem“, explains Gonçalo Neves.
An area with lower values may be associated with a nutritional deficiency, but it may also result from water stress, soil compaction, root problems, pests, diseases, or other agronomic limitations.
Therefore, vegetation indices should be viewed as a detection tool. Confirmation still depends on direct observation and, when necessary, on additional analyses, such as soil, water or sap analyses.
NDVI: the most used index to assess crop vigor
Among the various vegetation indices available, the NDVI (Normalized Difference Vegetation Index) is one of the most widely used.
This index is strongly associated with the plant's photosynthetic activity and is calculated through the combination of the red (RED) and near-infrared (NIR) bands.
The values obtained range from -1 to 1:
- Values between -1 and 0 usually indicate bare soil or vegetation without activity;
- Values between 0 and 1 reflect the presence of active vegetation;
- The closer to 1, the greater the vegetative vigor tends to be.
The interpretation of these values allows for highlighting differences in development within the same plot and guiding agronomic assessment.
How these indices are obtained
Vegetation indices result from the combination of different multispectral bands captured by sensors installed on satellites or drones.
Among the most used bands are:
- Red (RED)
- Red Edge (RedEdge)
- Green (GREEN)
- Blue (BLUE)
- Near infrared (NIR)
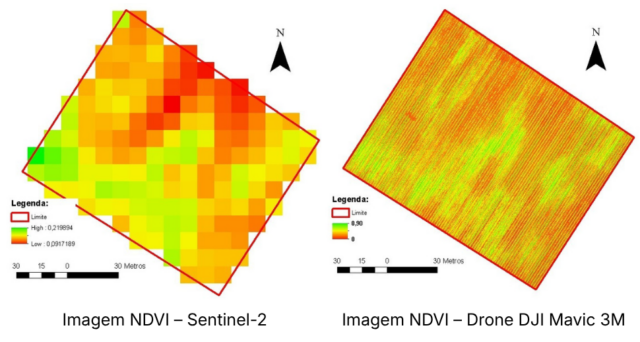
Currently, Sentinel-2 is one of the main sources of satellite imagery used in agriculture. Drones equipped with multispectral sensors, such as the DJI Mavic 3M, allow obtaining information with a much higher level of detail.
“The choice between drone and satellite always depends on the objective of the analysis and the level of detail necessary for decision-making", says Gonçalo Neves.
The main difference lies in the resolution and acquisition flexibility. While Sentinel-2 operates with resolutions on the order of 10 meters per pixel, a drone like the DJI Mavic 3M can achieve about 0.5 cm per pixel at 10 meters flight height, allowing for much greater detail in analyzing the variability within the plot.
The choice between drone and satellite should therefore be made based on the intended objectives and the information needed to support the decision.
Spatial and temporal assessment: monitoring the crop throughout the cycle
The value of vegetation indices is not just in observing a single moment.
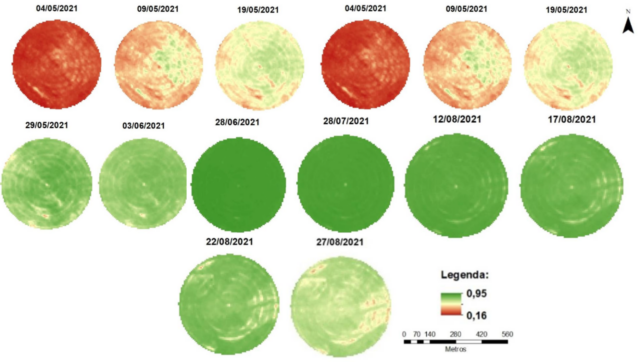
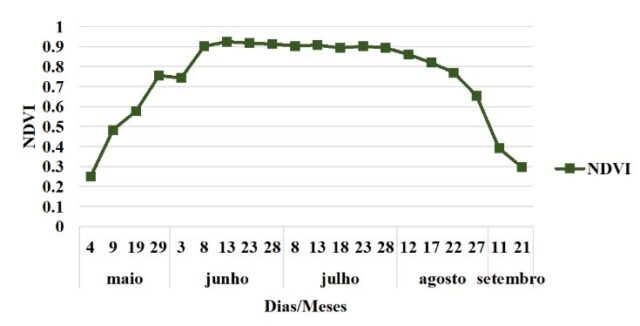
The spatial analysis allows for visualizing differences in vigor within the same plot and locating areas with distinct behaviors.
The temporal analysis allows for tracking the evolution of the culture throughout the cycle and understanding how it responds to production conditions, agronomic practices, or stress situations.
This continuous monitoring allows for earlier detection of trends and action before certain issues have a significant impact on productivity.
From detection to action: prescription maps
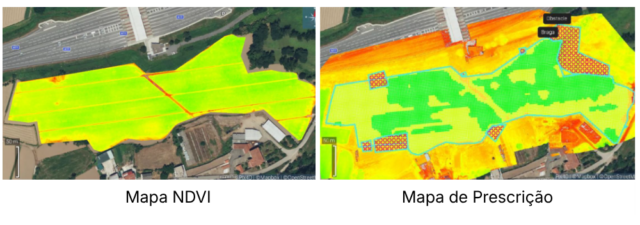
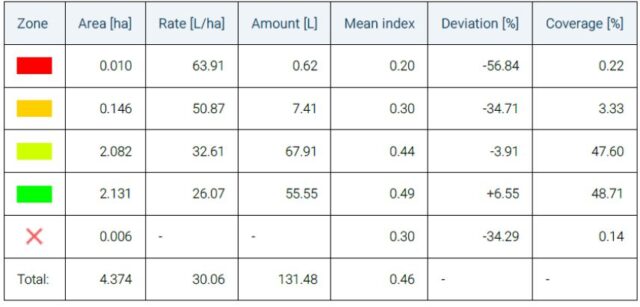
After identifying the existing differences in the parcel and confirming their causes, the information can be used to create prescription maps.
These maps are georeferenced application plans that allow for the adjustment of application rates and treatments to the specific needs of each area of the plot.
In reality, this translates into a more efficient use of fertilizers, plant protection products, and other production factors, as well as a more rational management of available resources.
The growing role of artificial intelligence
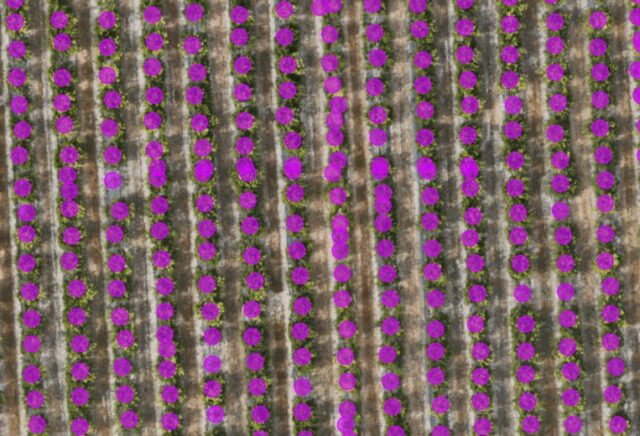
The evolution of artificial intelligence is creating new possibilities in the interpretation of information collected by drones and satellites.
Currently, there are already solutions capable of supporting tasks such as:
- Automatic plant identification;
- Plant counting;
- Assessment of installation failures;
- Early detection of diseases;
- Monitoring the development of crops.
These tools allow for the automation of tasks that previously relied on manual observation, with faster analysis and more information to support decision-making.
Technology that points the way. Agronomy that confirms.
The drones and the vegetation indices do not replace agronomic knowledge.
They allow observing more area, detecting variations earlier, and better directing the assessment of the crop. But the true value arises when the information collected is interpreted and validated by those who know the farm and the reality of the field.
“Vegetation indices allow us to focus our observations on the areas that warrant attention. Interpreting the results and identifying the causes still depend on agronomic assessments in the field”, concludes Gonçalo Neves.
Technology helps us figure out where to look, but confirmation still happens in the field.
If you wish to understand how to integrate drones, satellites, and prescription maps into your farm, the Hubel Verde team is available to assist you on the ground.
Contact us
Do you have a question or need support for your crop? Send us your request and we will get in touch.